Ripple price (XRP/USD) made a nice upside move from the $0.8500 support against the US Dollar. The price is now eyeing more gains and it seems like buyers are back.
The third largest cryptocurrency suffered heavy losses recently and was down by more than 65 percent from well above $3.00 to trade below $1.0000. The recent talks of cryptocurrencies ban in South Korea and China tightening regulations on agencies created panic and push all major digital currencies down. As per coinmarketcap, the total market value was down by roughly $30 billion.
Ripple Price Forecast Turning Bullish Again
Key Points
- Ripple price is now back in the bullish zone with a break above the $1.4000 resistance against the US Dollar.
- There was a break above a major bearish trend line at $1.4100 on the 4-hours chart of the XRP/USD pair.
- The pair now faces a key resistance zone near $2.0000-2.2000 where sellers may struggle.
After a sharp decline from well above $3.0000, Ripple price found bids just below the $1.0000 level. A low was formed at $0.8489 (data feed by bitfinex).
Later, an upside correction was initiated and the price moved above the $1.0000 and $1.2000 resistance levels. More importantly, there was a break above a major bearish trend line at $1.4100 on the 4-hours chart of the XRP/USD pair.
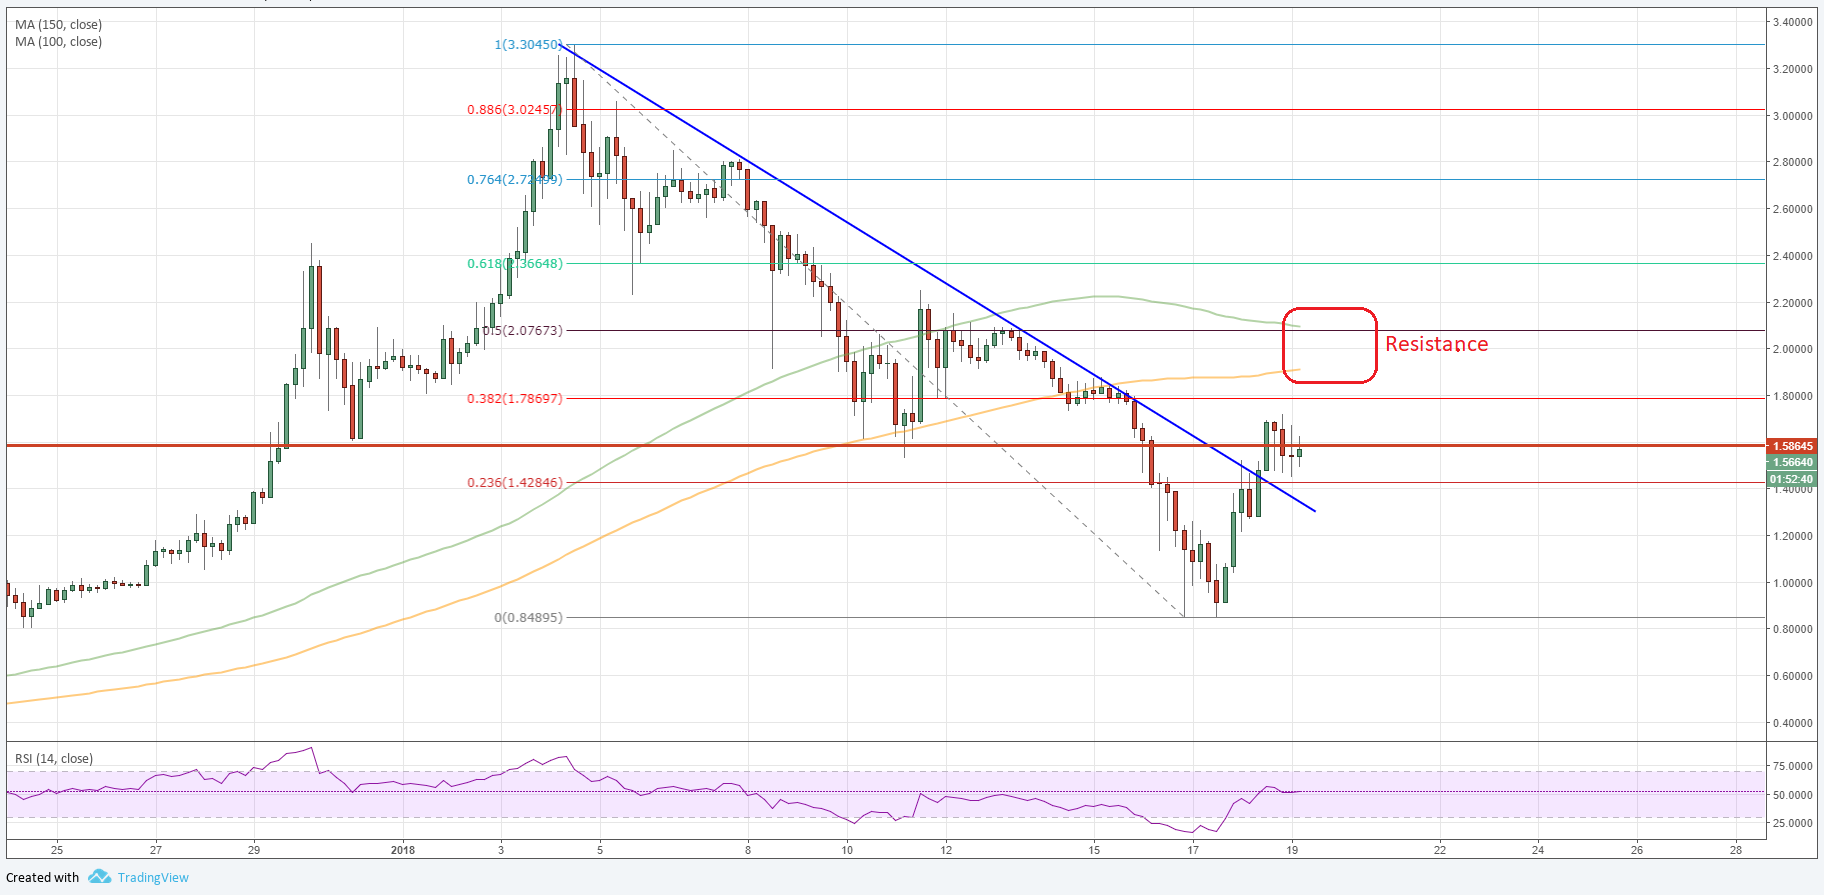
The pair is now trading above the 23.6% Fibonacci retracement level of the last decline from the $3.3045 high to $0.8489 low. This is a positive zone and suggest that buyers are back with a break above the $1.4000 level.
XRP/USD technical analysis and resistance levels
The XRP/USD pair is currently struggling to break the $1.6000 level. Above the stated $1.6000 level, the 150 simple moving average (4-hours, orange) is positioned at $1.8800.
However, the most important next hurdle is at $2.0700. It is the 50% Fibonacci retracement level of the last decline from the $3.3045 high to $0.8489 low. Moreover, the 100 simple moving average (4-hours, green) is also around $2.1000.
Therefore, the next big resistance for buyers is at $2.1000. A break above the mentioned level could push the price toward $3.0000. On the downside, the broken support at $1.4000 is a short term support followed by $1.2000.
Trade safe traders and enjoy the ride!!!