
Bitcoin price rallied 20% recently and broke a bearish trend line on the daily chart. Ethereum is likely following BTC and it could also break a similar trend line and rally to $260.
In the past few days, there was a strong rise in the cryptocurrency market. Bitcoin soared close to 20% and tested the $9,500 resistance area. Similarly, Ethereum, ripple and litecoin gained bullish momentum above $200, $0.2000 and $45.00 respectively.
If we look at the daily chart of bitcoin, there was a steady rise from the $3,800 swing low. BTC broke many hurdles near $7,150 to move into an uptrend. Besides, there was a break above the 50% Fib retracement level of the last major decline from the $10,498 high to $3,800 low.
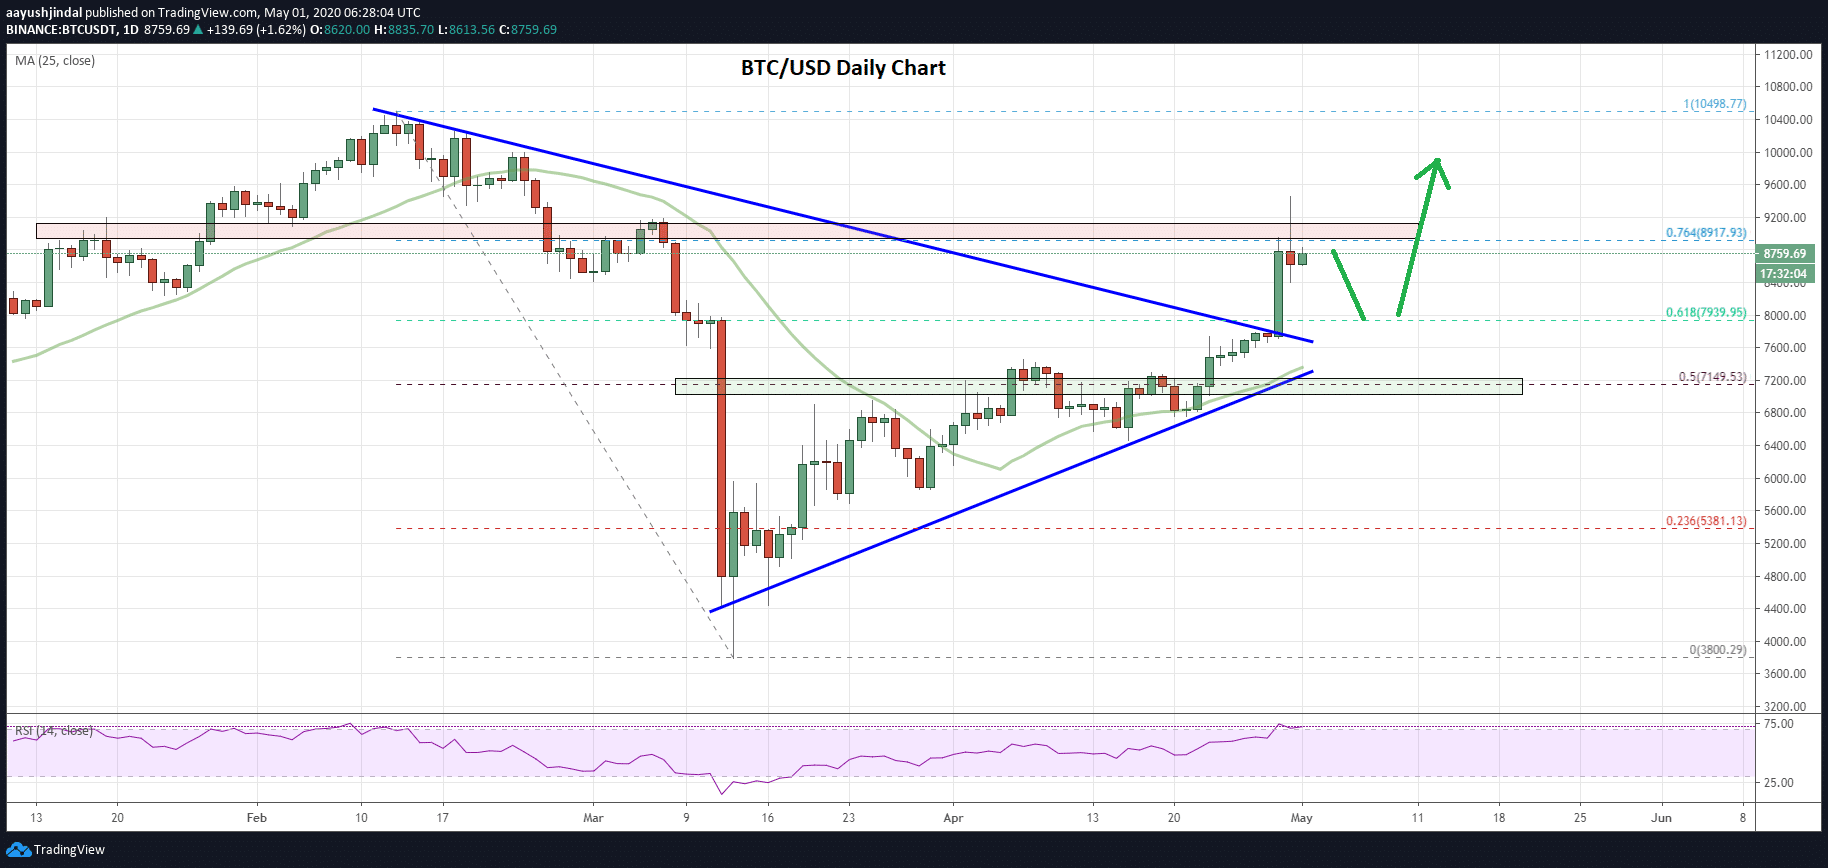
Bitcoin Price Daily Chart
More importantly, there was a break above a major bearish trend line on the daily chart at $7,800. It opened the doors for a sharp upward move above $8,000 and $8,500.
BTC even climbed above the $9,000 level and the 76.4% Fib retracement level of the last major decline from the $10,498 high to $3,800 low. However, it struggled to continue above the $9,500 level and it is currently consolidating gains. In the short term, there could be a downside correction towards $8,000 before bitcoin starts another upward move.
Ethereum Could Follow Bitcoin’s Pattern
Looking at the daily chart of Ethereum, there is a similar pattern to bitcoin. ETH also started a steady rise from the $85 swing low. It surpassed the $120 and $150 resistance levels.
There was a break above the $200 resistance and the 50% Fib retracement level of the main slide from the $288 high to $85 low. However, Ether is yet to break a similar bearish trend line on the daily chart at $220.
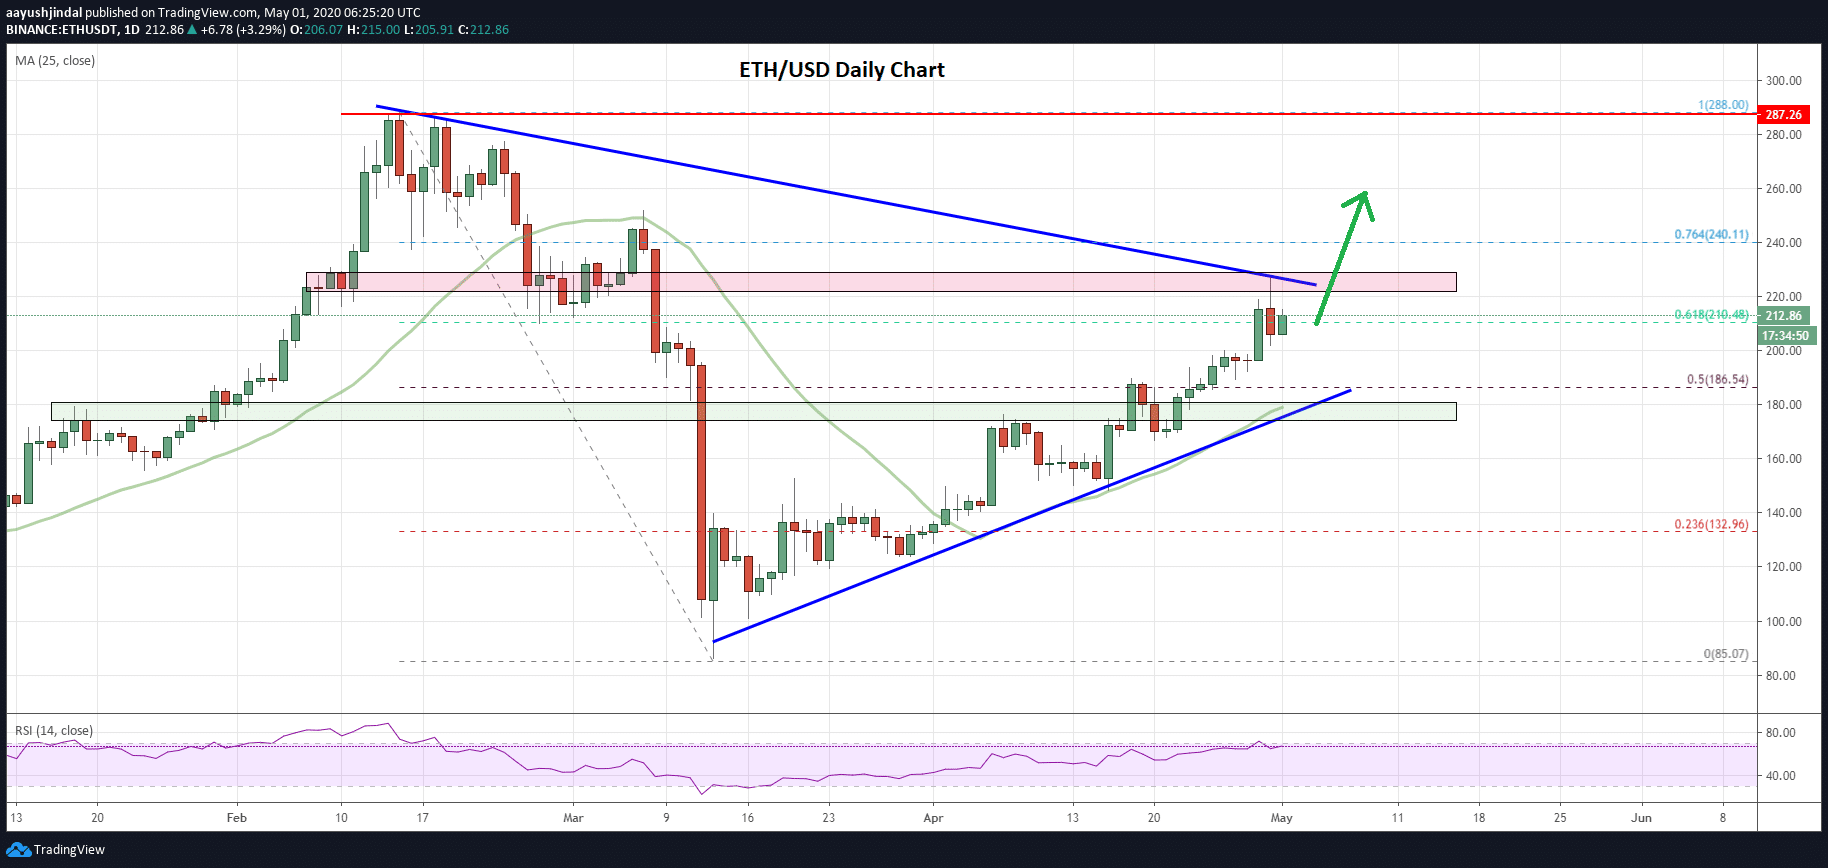
Ethereum Price
If we consider the recent bitcoin rally above the trend line, ETH might also clear the trend line and rally 15%-20% in the coming days.
In the mentioned scenario, Ethereum is likely to hit the $250 and $260 resistance levels. On the downside, the previous hurdle near the $185 level is likely to act as a strong support zone for the bulls.
Featured image from unsplash


Pingback: Bitcoin Price Testing Crucial Weekly Resistance: Can BTC Rally Above $10K?