
Litecoin price LTC faced a major resistance near $175.00 against the US dollar. LTC/USD is following a major downtrend and it could retest the $120 support.
The last recovery from the recovery from the $136.00 swing low in LTC/USD was convincing. However, the upside move was capped by a crucial hurdle near $175.00. As a result, there could be a downside reaction in the near term with supports near $150.00, $135.00 and $120.00. As per the current market cap of around $8.8 billion, Litecoin stands at the 5th position (as per coinmarketcap). However, the total market cap is down by more than 50% from the last high of around $20 billion.
Key Points
- Litecoin price is in a bearish trend below the $175.00 resistance level versus the US dollar.
- There is a monster declining channel in place with current resistance at $165.00 on the 4-hour chart of the LTC/USD pair.
- The pair remains at a risk of more losses as long as it is below the $165.00 level.
Litecoin Price Analysis and LTC/USD Forecast
There was a major downtrend initiated in litecoin price from well above the $240.00 level against the US Dollar. The LTC/USD pair followed a bearish path and traded below the $200.00 and $180.00 support levels.
Recently, the pair traded as low as $136.69 (Exchange feed via Bitfinex) before starting a recovery. It corrected higher and moved above the $150.00 level. However, the upside move was capped by a crucial resistance at $175.00.
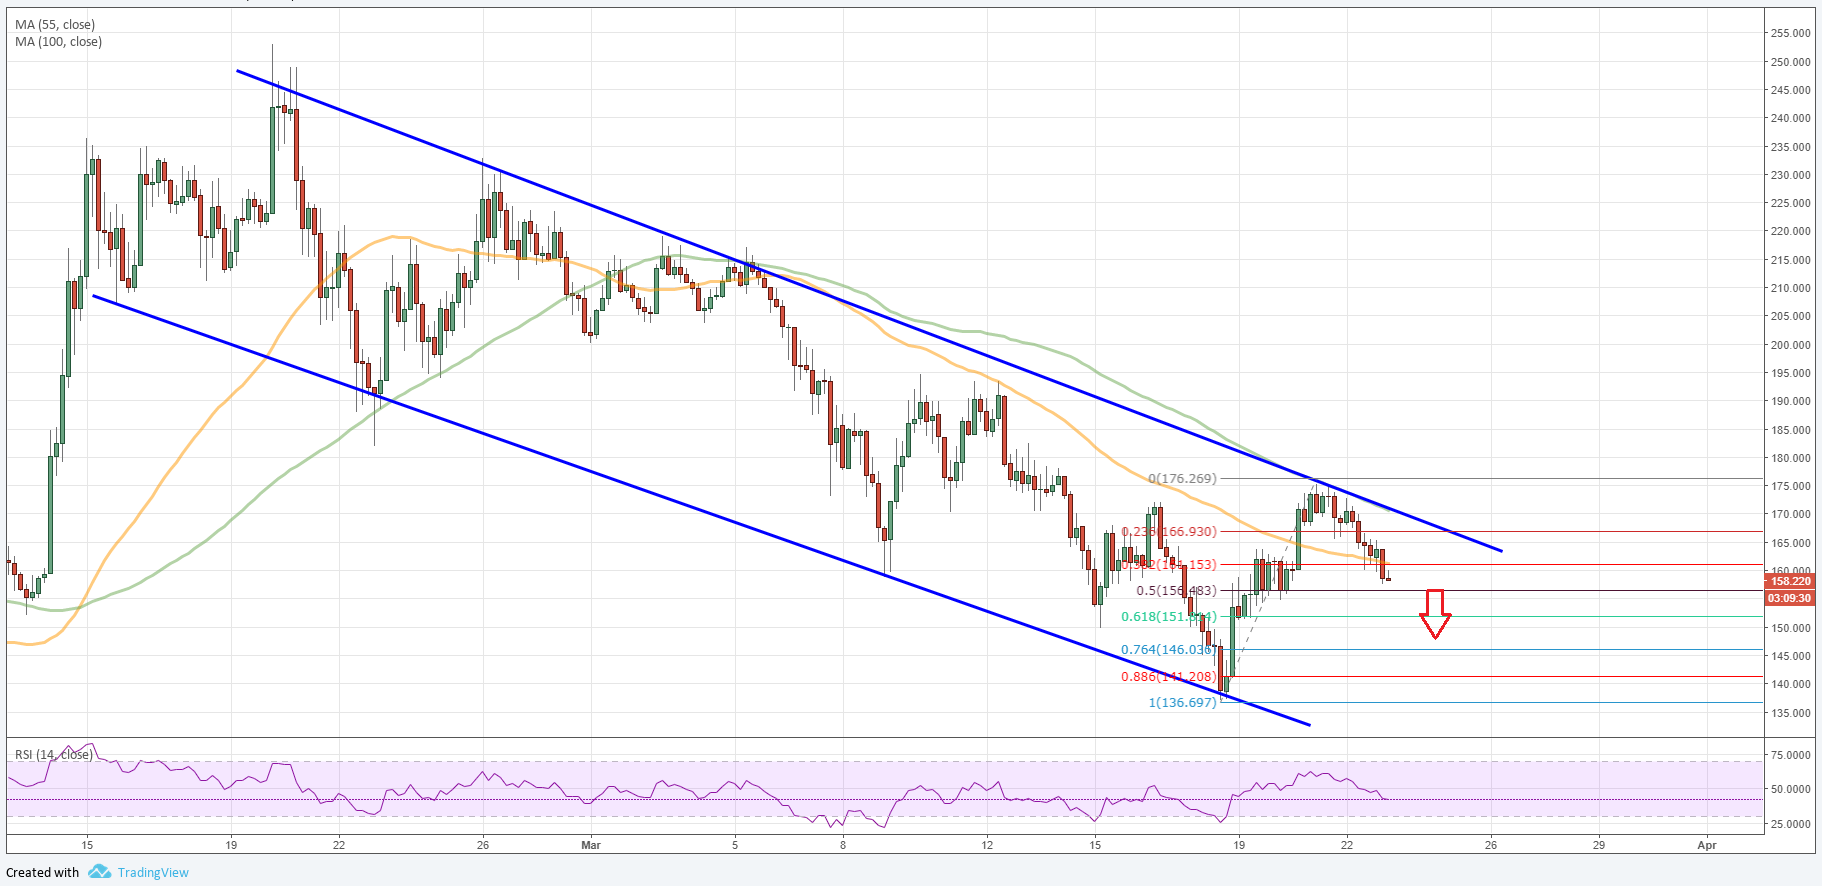
Litecoin Price Analysis LTC/USD 4-hour Chart
Moreover, a monster declining channel in place with current resistance at $165.00 on the 4-hour chart also prevented gains. More importantly, the price struggled to trade above the 100 simple moving average (green) at $175.50 on the same chart.
The pair is once again declining and it has breached the 23.6 percent Fibonacci retracement level of the last wave from the $136.69 low to $176.26 high. At the moment, the price is below $160.00 and the 200 simple moving average (orange).
It seems like the current downtrend may extend and the price could even break the $150.00 support. A break below the $150.00 support and the 61.8 percent Fibonacci retracement level of the last wave from the $136.69 low to $176.26 high may perhaps accelerate declines.
Once litecoin sellers gain control, the price could even break the last swing low of $136.69. The next major support is at $120.00. On the upside, a successful 4-hour close above $170.00 and the 100 SMA is needed to start a fresh upside move.