
Ripple price declined sharply this past week and traded below $1.0000 against the US dollar. XRP/USD is currently correcting higher, but let’s see what it needs to move back in the bullish zone.
The cryptocurrency market faced a lot of selling pressure this past week since bitcoin, Ethereum’s ether, ripple, bitcoin cash, cardano, litecoin and all major altcoins declined heavily. The crypto market value was down by more than 30% percent during the past few days and it currently stands at $456,025,806,615, as per the coinmarketcap data feed.
Key Points
- Ripple price found support at $0.7000 and it is currently correcting higher against the US dollar.
- XRP/USD has to move above a crucial bearish trend line with resistance at $1.2400 on the 4-hours chart.
- A proper close above $1.2400 and $1.2500 is needed for buyers to retain the lost momentum.
Ripple Price Forecast with Recent Decline
Let’s understand the recent moves with the help of XRP/USD’s 4-hours chart (data feed by bitfinex). We saw a massive rally earlier, and the ripple price forecast 2018 posted by my colleague Latika Mehrotra was spot on with the target of $2.0000. Later, the pair declined heavily this past week and broke two important supports near $1.2500 and $1.0000.
The market cap for Ripple was down from $80,126,475,045 to well below $35,126,475,045. It currently stands at $37,126,475,045 with the current market price of $0.9517.

A new yearly low was formed near $0.7000 from where the price started an upside correction. It has moved above the 23.6% Fibonacci retracement level of the last major decline from the $1.4806 high to $0.6850 low. However, there are many hurdles for ripple buyers on the upside such as $1.0000 and $1.2500.
XRP/USD Technical analysis
Clearly, the 4-hours chart of XRP/USD points a couple of important resistances. An initial barrier is near $1.0000, which is a psychological level. Above $1.0000, the 50% Fibonacci retracement level of the last major decline from the $1.4806 high to $0.6850 low could prevent upsides.
Above $1.1000, there is also a crucial bearish trend line with resistance at $1.2400. Therefore, there is a cluster of resistances forming for ripple price starting with $1.0000 up to $1.2500.
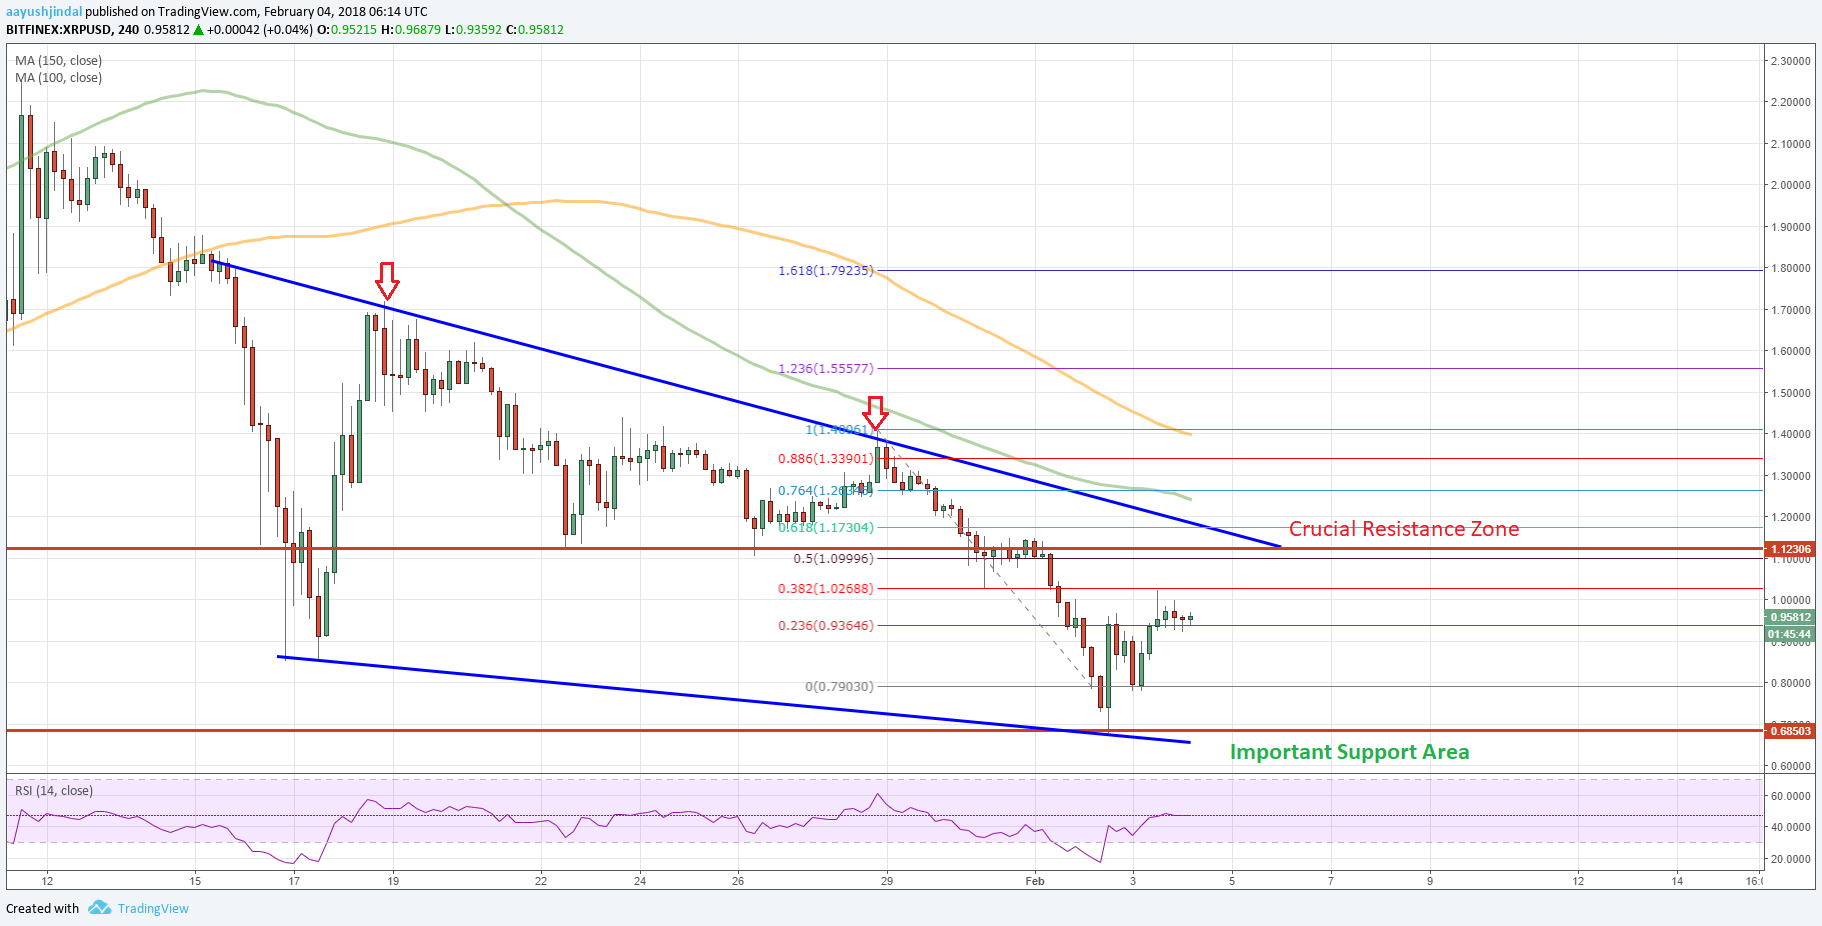
A 4-hour close above $1.2500 and the trend line could open the gates for more upsides in the near term. The next target might be $1.4000 followed by $1.5000.
On the flipside, if XRP/USD fails to move above $1.2500, it could decline once again to retest $0.8000 or even $0.7500. In the short-term, there can be ranging moves above $0.8000 before ripple price makes an attempt to break $1.2500 and regain the lost bullish momentum.
Trade safe traders and enjoy the ride!!!


Pingback: Ripple Price Prediction: XRP to USD Facing Uphill Task