Ripple price fell sharply after Google’s announcement of banning cryptocurrencies related ads. XRP/USD declined and is currently testing a crucial support on the daily chart.
The past few days were mostly bearish as the cryptocurrency market struggled to recover. Adding fuel to the fire, Google recently announced that they will ban all ads related to bitcoin and cryptocurrencies. The total marker cap is now down to $325,451,878,500 from well above $500b (as per coinmarketcap). It prompted heavy selling and coins such as bitcoin, ether, ripple, bitcoin cash and other declined sharply.
Ripple Price XRP Key Takeaways:
- Ripple price fell sharply with a daily close below the $0.80 support against the US Dollar.
- There is a crucial bearish trend line with resistance at $0.95 on the daily chart of the XRP/USD pair.
- The pair is currently testing a crucial support at $0.6350, which holds the key for the next move.
As mentioned, there was a sharp downside move during the past few days, which pushed XRP price below the $0.8000 support level. There was even a daily close below the stated $0.8000, which is a bearish sign.
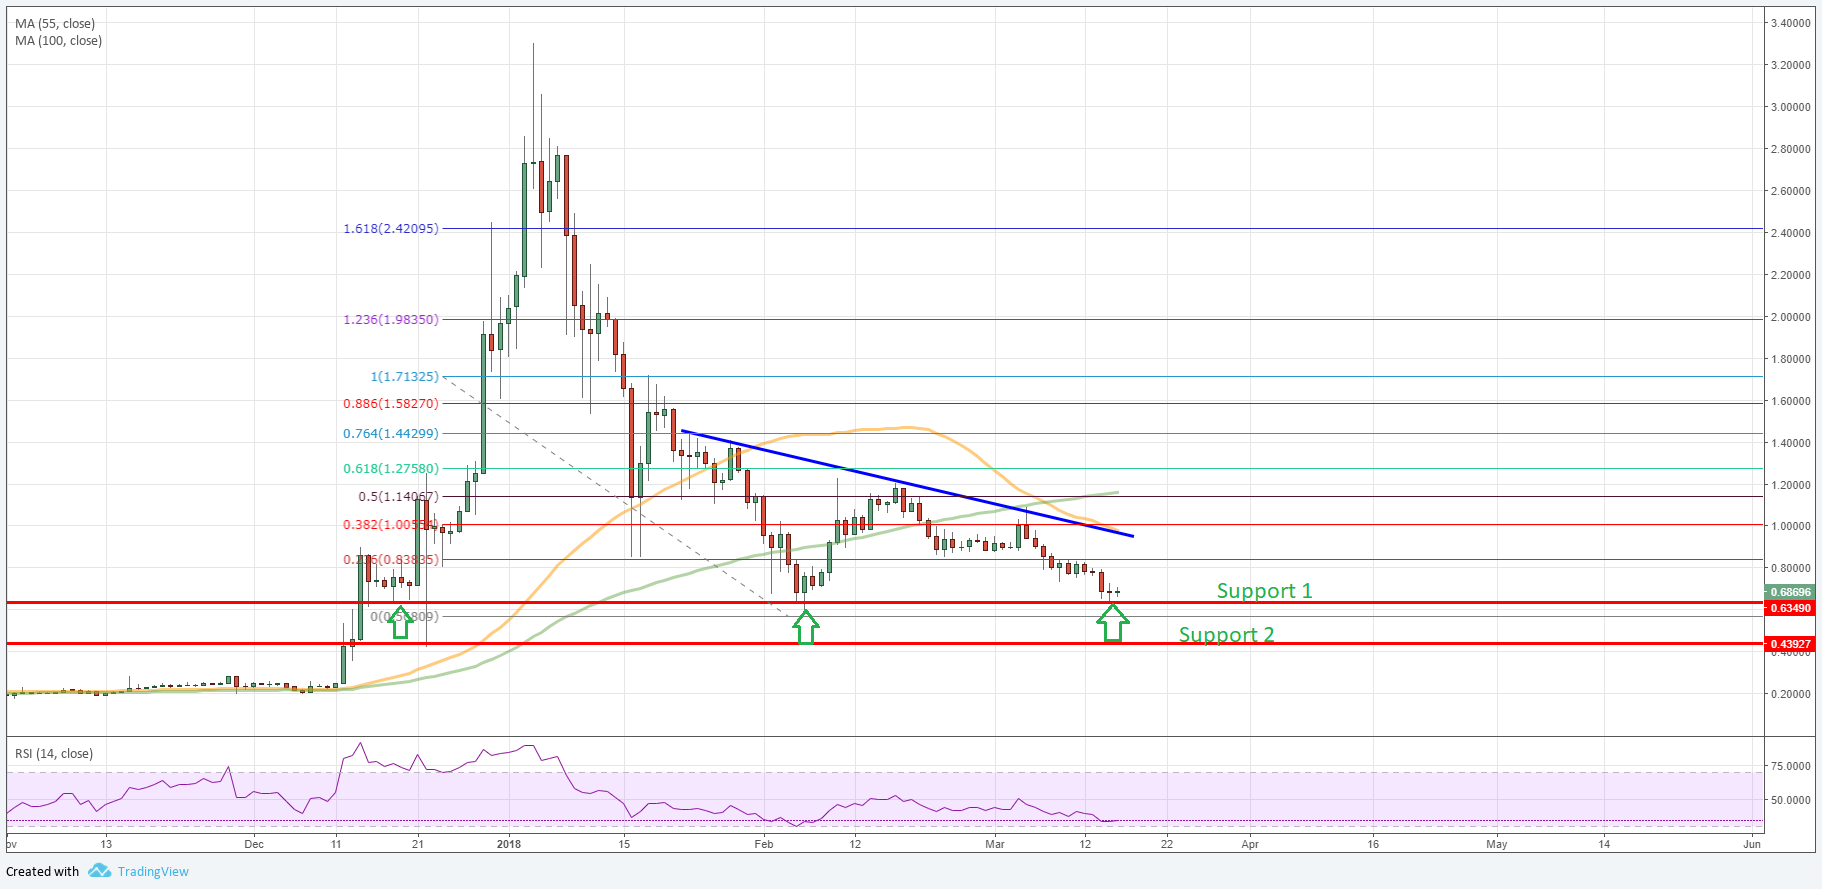
Ripple XRP to USD Daily Chart
However, the best part is the fact that the price is currently trading near a crucial support on the daily chart at $0.6350. The mentioned $0.6350 level acted as a support on many occasions earlier and it may continue to act as a barrier for sellers.
Can Ripple to Dollar (XRP/USD) Hold This?
The daily chart of XRP/USD clearly suggests the importance of the $0.6350 support. The recent decline stalled right at the mentioned $0.6350 support. Therefore, there are chances of a recovery above $0.7000 in the near term.
On the upside, an initial resistance on the daily timeframe is around the 23.6% Fib retracement level of the last decline from the $1.71 high to $0.5680 low at $0.8300. Above $0.8300, there is a crucial bearish trend line with resistance at $0.95.
The trend line resistance near $0.9500 is significant since the 150-day simple moving average (orange) is also near the same level. Therefore, a proper close above the $0.9500 level and the 100-day SMA could open the doors for more gains.
On the flip side, if the price fails to hold the $0.6350 support, the next major support is at $0.4500.
Chart Courtesy: Trading View


Pingback: STEEM Cryptocurrency Price Skyrockets Above $2.00