Ethereum price faced a lot of sellers today and declined below $800.00 against the US dollar. It seems like ETH/USD could accelerate declines towards the $700.00 level.
The cryptocurrency market faced a lot of selling pressure today. Bitcoin price nosedived and moved below $10,000. It prompted a bearish pressure on Ethereum, Ripple and other major altcoins as well.
Ethereum Price Analysis
The current price action is bearish on Ethereum price as it broke a couple of important support levels such as $860.00 and $800.00. The recent break below $800.00 in ETH/USD is a solid bearish signal and suggests that the price could decline further.
Looking at the 4-hours chart, it seems like the pair failed to break a major bearish trend line at $982.00. There were two attempts to break the same trend line and the most recent attempt was at $960.00 (data feed by bitfinex).
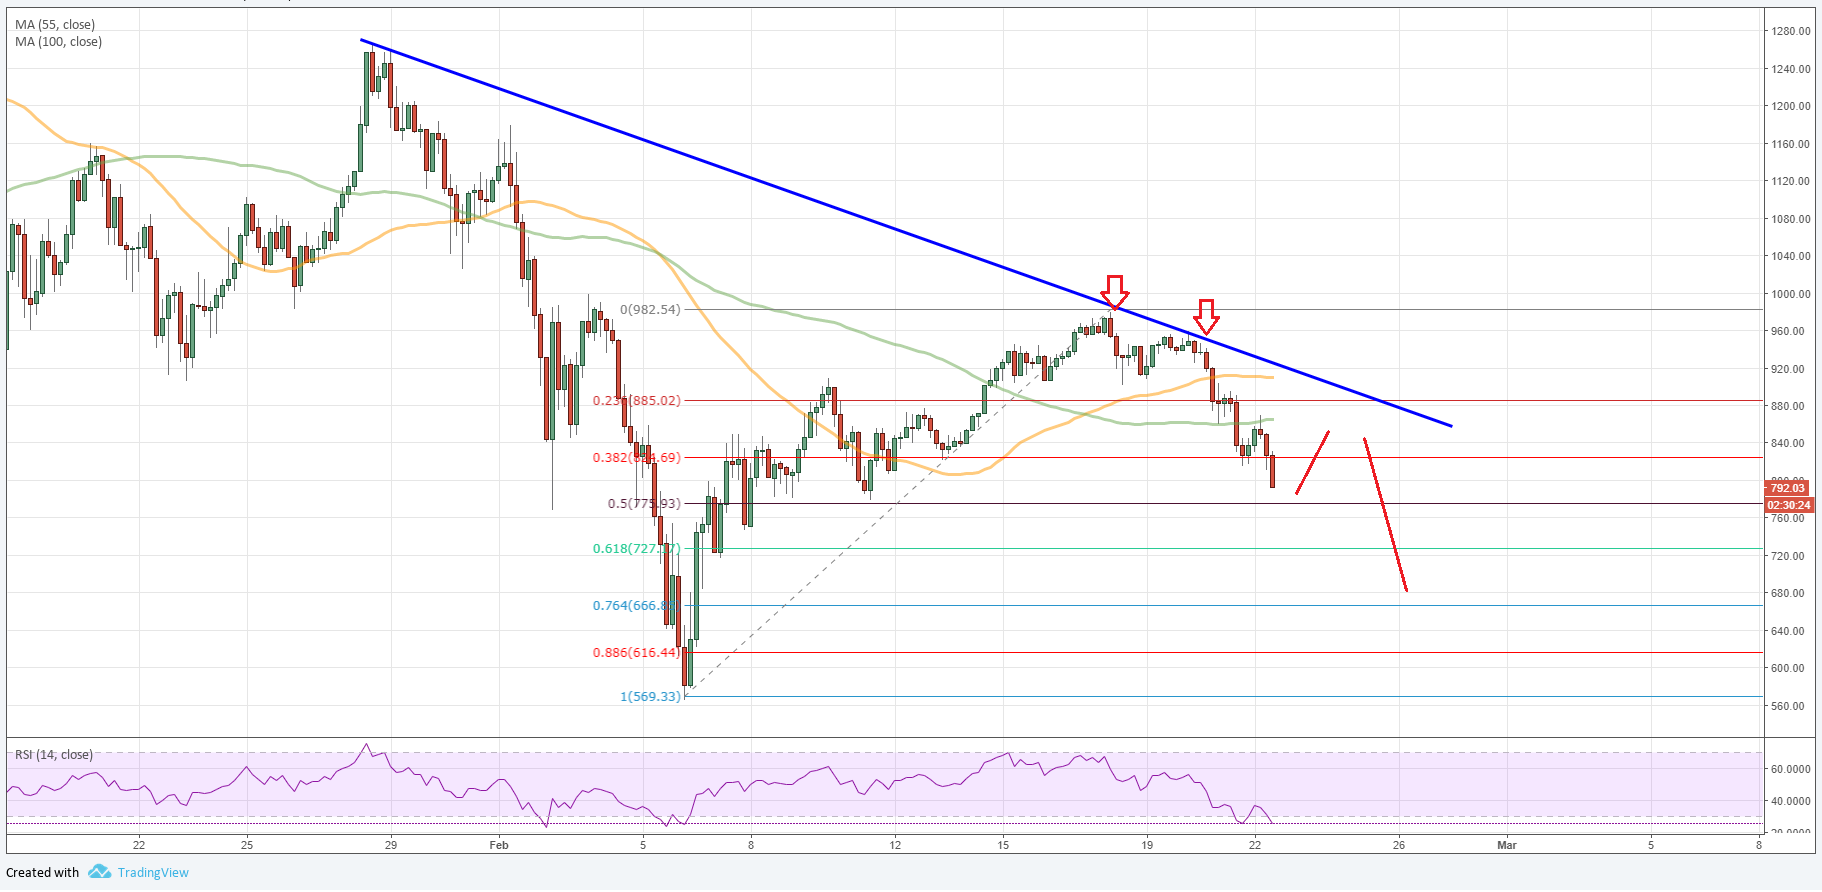
Ether buyers failed to surpass the trend line, which resulted in a sharp downside move. The price is now trading below the 100 and 150 simple moving averages (4-hours), which is a bearish signal below $800.00.
More importantly, it looks like an upside correction from the $869 swing low is over. If that is the case, the price could decline further towards $700 in the near term.
It has already declined below the 38.2% Fib retracement level of the last wave from the $569 low to $982 high. Therefore, there are chances of more declines towards the next immediate support at $775.
The stated $775 support is the 50% Fib retracement level of the last wave from the $569 low to $982 high. If ETH price even fails to hold the $775 level, then the gates for a test of the $700 would open.
Any further declines below the $700 level would depend on how the price trades in the next few sessions. If Ether sellers remain in control, then the price could even slide all the way back to $650.
In the short term, Ethereum price may remain in a downtrend towards the $700 level. On the upside, resistances are at $820, $840 and the same bearish trend line with current hurdle at $880.