
Ripple price traded higher recently, but faced sellers near $0.5200 against the US Dollar. XRP price remains in a bearish trend and it could decline further.
This past week and over the weekend, there was a decent recovery in the cryptocurrency market. Bitcoin, Ethereum and ripple recovered and moved up around 10-15%. However, gains were limited and today, it seems like the market is facing renewed selling pressure.
Ripple Price Chart Takeaways:
- Ripple price failed to settle above the $0.5000 and $0.5200 resistance levels against the US Dollar.
- There is a major bearish trend line in place with resistance at $.4950 on the 4-hours chart of XRP/USD.
- The pair remains in a bearish trend and it could extend the decline below $0.4600 in the near term.
Looking at the 4-hours chart, ripple price started a decent upside move from the $0.4250 swing low. It gained traction and recovered above the $0.4500 and $0.4800 resistance levels.
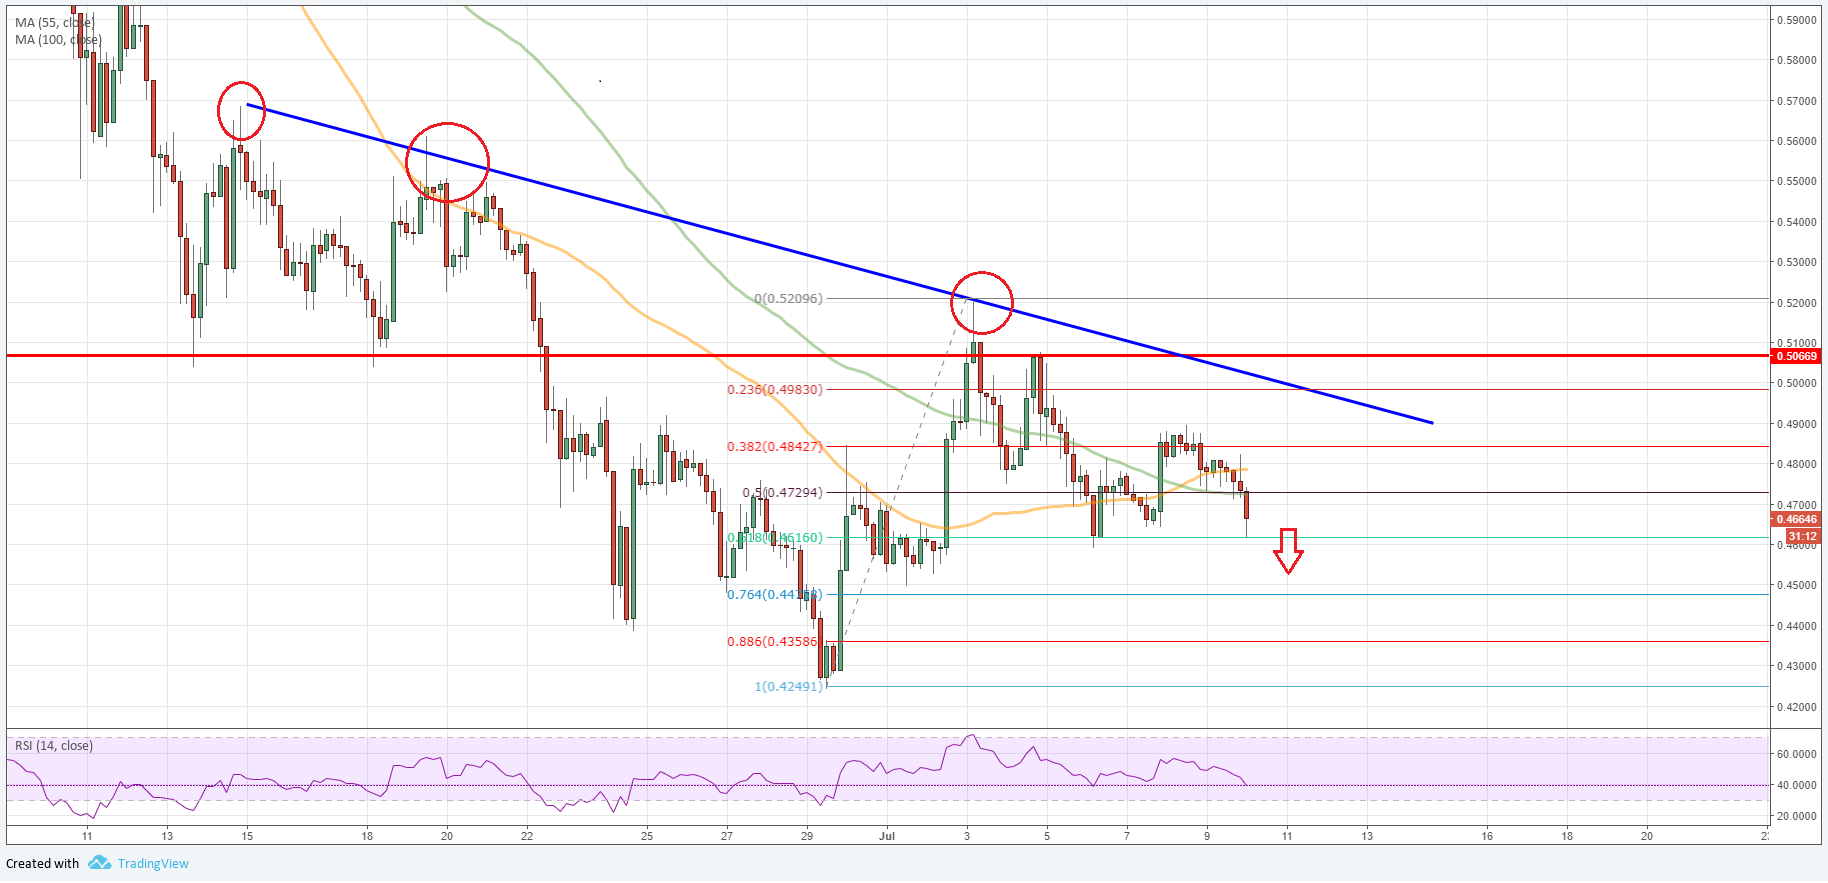
There was also a break above the $0.5000 resistance, the 55 simple moving average (orange, 4-hour), and the 100 SMA (green). However, the price faced a solid selling interest near the $0.5200 resistance.
More importantly, a major bearish trend line with current resistance at $.4950 also prevented gains on the 4-hours chart of XRP/USD. The pair started a fresh downside move and declined back below $0.5000 and the 100 SMA.
The decline was such that the price broke the 50% Fib retracement level of the last correction from the $0.4249 low to $0.5209 high. It is now trading below the $0.4800 support and the 50 SMA. These all are bearish signs and suggests that the price could decline further in the near term.
An initial support is near the 61.8% Fib retracement level of the last correction from the $0.4249 low to $0.5209 high at $0.4600. A break below this could accelerate declines towards the $0.4400 level. Finally, the last swing low at $0.4250 may perhaps be tested if the price fails to stay above $0.4400.
On the upside, an initial resistance is near the $0.4800 level. There is also a major bearish trend line in place with resistance at $.4950 on the 4-hours chart of XRP/USD.
Therefore, any major recoveries are likely to be capped by the $0.4850 and $0.4900 resistance levels.